
Insights
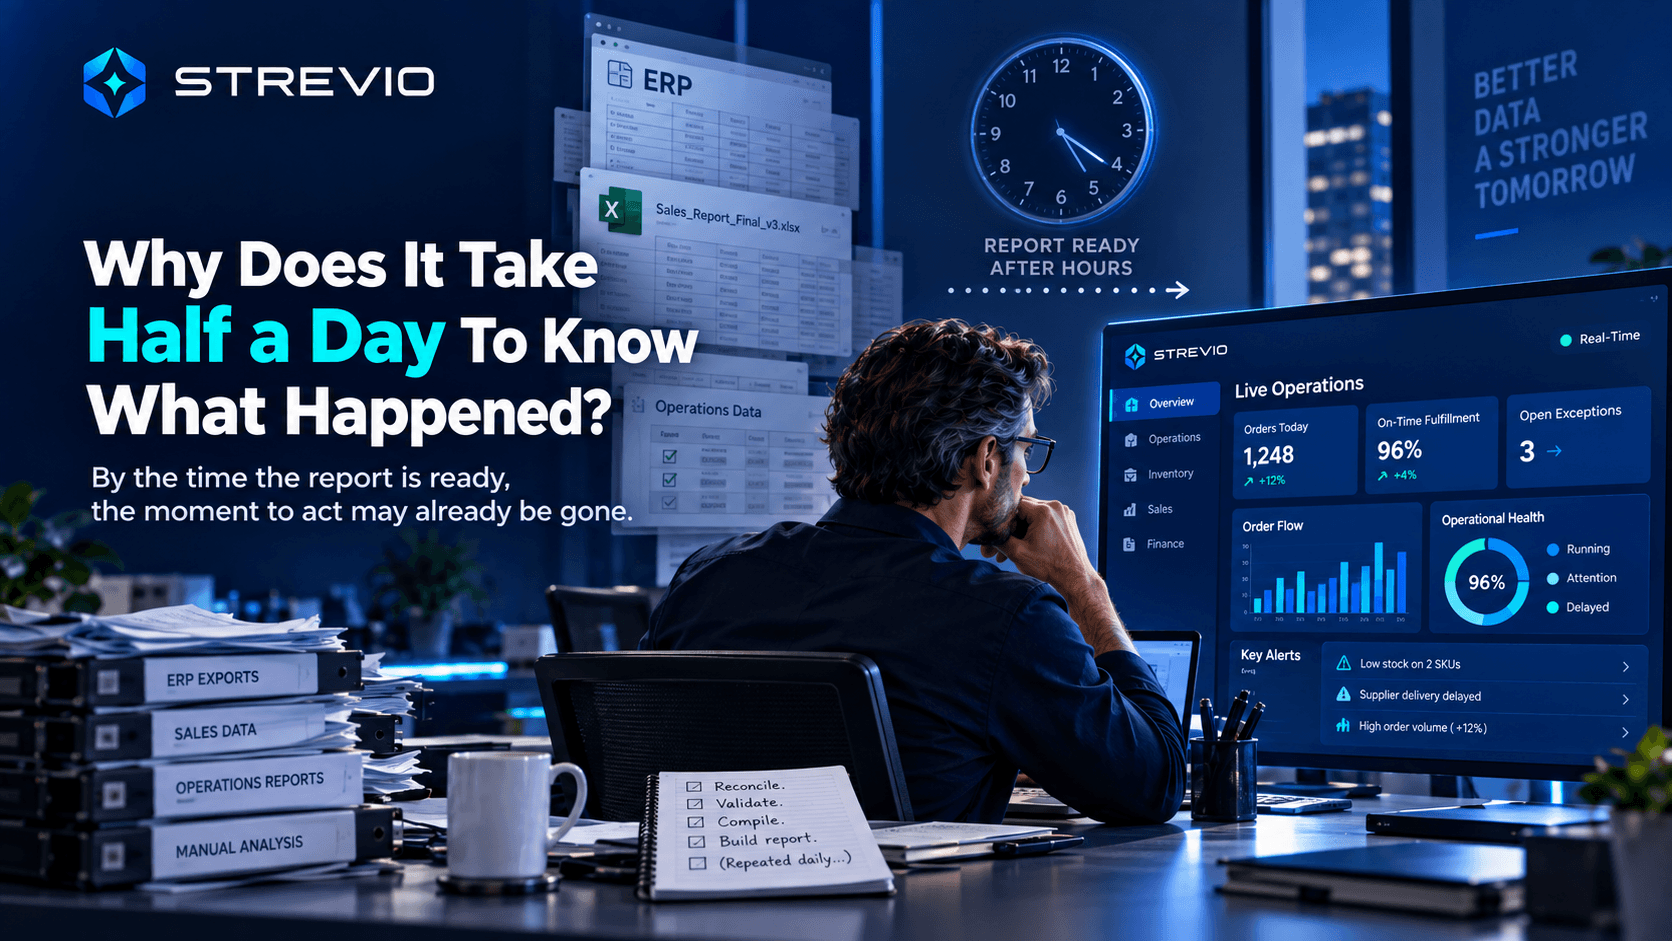
Why Does It Take Half a Day Just to Know What Happened in Your Business?
By the time the report is ready, the moment to act may already be gone.
In This Article
- The problem is not reporting. It is reporting latency.
- The report is not the business
- Data, reporting and operational visibility are not the same thing
- Most growing companies do not have a shortage of data. They have a shortage of answers.
- Why does one report take half a day?
- The invisible cost is what happens while management is waiting
- Every piece of information has a decision window
- A report can be correct and still be too late to be useful
- Why reports become rituals
- Some reports exist because the business cannot answer questions directly
- A polished management pack can create false confidence
- A dashboard by itself is not operational visibility
- The difference between a dashboard and an operational view
- Management does not need more numbers. It needs better signals.
- If every number generates another question, you do not have enough visibility yet
- The owner should not need to become a data analyst before making a decision
- Slow decisions are not always caused by slow managers
- There is also a difference between seeing and understanding
- From reporting to operational control
- This is where AI can help, but it is not the starting point
- What should management actually see?
- Good visibility should make the business quieter
- Two examples of reporting becoming operational capacity
- Before automating a report, ask why it exists
- Start with the decision, then design the dashboard around it
- More reports are not necessarily better reporting
- The best reporting process may be one nobody has to prepare manually
- The faster you see reality, the longer you have to change it
- Stop reconstructing the business after it happens
It is Friday morning.
You ask what sounds like a simple question:
“How did we actually do this week?”
Nobody quite knows.
Finance needs to update its file.
Operations is waiting for two numbers from purchasing.
Sales has its own report.
The ERP says one thing.
Excel says something slightly different.
Someone starts exporting data.
Another person checks whether the latest orders are included.
A manager wants margin by customer.
Someone else remembers that three invoices need correcting before the numbers make sense.
By lunchtime, the report is finally ready.
Great.
Except the business did not start happening at lunchtime.
It has been happening since Monday.
Orders were placed.
Margins moved.
Stock changed.
Suppliers missed dates.
Customers bought.
Problems appeared.
And management only got a reliable picture several days later.
The obvious problem is the four hours spent preparing the report.
But that may not be the expensive part.
The expensive part is that management needed four hours of reconstruction before it could see its own business.
That is not simply a reporting problem.
It is a visibility problem.
And when the information arrives after the best moment to act, it becomes a decision problem too.
The problem is not reporting. It is reporting latency.
Most businesses need reports.
There is nothing wrong with that.
Financial reporting.
Sales reporting.
Inventory reporting.
Procurement reporting.
Management reporting.
The problem begins when there is too much time between something happening and the people responsible for the business understanding that it happened.
I think of this as reporting latency.
It is the delay between operational reality and management awareness.
A supplier misses an important confirmation on Monday.
Purchasing notices it on Wednesday.
It reaches management in Friday's report.
The report is accurate.
The problem is already four days old.
Or perhaps margin on a product starts deteriorating because freight costs changed.
The numbers eventually appear correctly in the monthly management pack.
Excellent accounting.
Unfortunately, the company has already sold another three weeks of orders at the wrong economics.
This is why a report can be perfectly accurate and still arrive too late to be useful.
The issue is not only:
“How quickly can we produce the report?”
It is:
“How much time do we have between something changing and the point where knowing about it becomes much less useful?”
That is a different question.
And it is much closer to how an operator should think.
The report is not the business
This sounds obvious, but companies forget it surprisingly often.
The business happens first.
Then the report explains what happened.
An order was late before the KPI turned red.
Margin deteriorated before the chart showed it.
Stock disappeared before somebody reconciled the spreadsheet.
A customer became unhappy before the management pack mentioned service performance.
The report is a representation.
Not reality itself.
This is why management reporting should not become the first place where management discovers operational problems.
Period-end reports absolutely have value. APQC describes them as an important form of decision support, including financial highlights, trends and variance analysis. Its benchmarking across thousands of organisations also shows that period-end management reporting can take several days to complete.
That is useful context.
A 20-person trading company should not blindly compare itself with a large multinational.
But the principle matters:
A lot of management information is still produced retrospectively.
And retrospective information is excellent for answering:
“What happened?”
It is less useful when the question is:
“What should we do now?”
Data, reporting and operational visibility are not the same thing
These three ideas often get mixed together.
They shouldn't.
Data
Data is what happened.
Orders.
Invoices.
Purchase orders.
Stock movements.
Customer payments.
Supplier dates.
Freight costs.
Discounts.
Delivery performance.
Data is the raw material.
Most growing businesses have plenty of it.
Often too much.
Reporting
Reporting organises that data into something people can consume.
A spreadsheet.
A management pack.
A dashboard.
A weekly sales report.
A finance report.
A KPI summary.
Reporting makes the data understandable.
Operational visibility
Operational visibility answers a different question:
What do I need to know now because something may require action?
That distinction is critical.
Suppose a supplier promised confirmation Monday.
Monday passes.
No confirmation.
On Friday, the weekly procurement report correctly shows:
Supplier confirmation overdue: 4 days.
The reporting worked.
The operational visibility did not.
The business needed to know on Tuesday.
Not because every late confirmation is a crisis.
But because Tuesday still gave the team options.
By Friday, options may have become explanations.
Most growing companies do not have a shortage of data. They have a shortage of answers.
We live in a strange period.
Companies are collecting more information than ever.
Yet management teams still regularly say:
- “I don't know.”
- “Let me check.”
- “Can someone pull the numbers?”
- “Which report is correct?”
- “Ask finance.”
- “Ask operations.”
- “Give me an hour.”
Research from Salesforce reflects this contradiction. Business leaders increasingly describe themselves as data-driven, yet many still lack full confidence that the information they need is accurate, accessible or easy to interpret.
That is the real issue.
More systems.
More data.
More reports.
More dashboards.
And still not enough confidence to answer a straightforward business question.
The problem is not always that information does not exist.
Often it exists in too many places, in slightly different forms, updated at different times and owned by different people.
The business has data.
Management is still reconstructing reality.
Why does one report take half a day?
Usually because the report is the last stage of a much larger manual process.
Someone exports from the ERP.
Someone else maintains a separate spreadsheet.
Finance has adjusted numbers that operations has not seen yet.
Sales uses a different customer classification.
The warehouse has updated stock manually.
Purchasing has supplier information sitting in email.
Then someone needs to bring everything together.
So report preparation begins.
Export.
Copy.
Paste.
Check.
Reconcile.
Ask.
Wait.
Correct.
Format.
Write commentary.
Check again.
Send.
Management sees the finished report and thinks:
“This took four hours.”
But the four hours are simply where all the fragmentation becomes visible.
The real problem began much earlier.
PwC's CFO research has found report preparation remains time-consuming and resource-intensive in many businesses, particularly where manual processes continue to sit underneath management reporting.
That is why speeding up only the final presentation is not always enough.
If the information underneath still needs three people to rebuild it, the business has improved the final output without fixing the information flow creating the workload.
The invisible cost is what happens while management is waiting
Imagine the weekly management report takes four hours to prepare.
The obvious calculation is:
Four employee hours multiplied by hourly cost.
Useful.
But consider what else may be happening.
A customer account became less profitable on Monday.
Management sees it Friday.
A supplier slipped Tuesday.
Management sees it Friday.
An inventory problem started Wednesday.
Management sees it Friday.
A salesperson has been discounting unusually aggressively all week.
Management sees it Friday.
The report-preparation cost is four hours.
The decision delay may be much more valuable.
That is the part companies rarely calculate.
Because there is no line in the P&L called:
“We realised three days too late.”
Sometimes nothing happens.
Fine.
Sometimes those three days mean:
- Less negotiating leverage
- Fewer sourcing options
- Another customer promise made with bad information
- Another low-margin order accepted
- An unnecessary air shipment
- Another week of the wrong behaviour
The faster management can see reality, the longer it has to change it.
Every piece of information has a decision window
This is why I do not believe every number needs to be real-time.
That is another easy technology trap.
Imagine a dashboard updating your monthly office-rent expense every twelve seconds.
Technically impressive.
Operationally pointless.
Different information has different urgency.
A missed supplier confirmation may matter today.
A shipment delay may matter within hours.
Available inventory may need to be current when somebody promises stock to a customer.
Cash position may need daily attention.
Monthly rent does not.
Quarterly strategic KPIs have a different rhythm again.
What matters is the decision window.
How long do you have after something changes before the value of acting starts falling?
That should determine how quickly the business needs the information.
Not:
“Can the technology technically make this live?”
There is no prize for making every piece of information real-time.
There is significant value in making the right information visible at the right time.
A report can be correct and still be too late to be useful
Suppose your management report says a major customer generated only 8% gross margin last month.
The figure is perfect.
Finance checked it three times.
Very accurate.
But if the commercial team continued accepting orders from that customer for four weeks before management saw the result, the accuracy does not change what happened.
The number answers:
“What did we make?”
What management may actually have needed was:
“Which current orders are falling below our expected margin, and why?”
These are different questions.
One is financial reporting.
The other is operational control.
Both matter.
But one should not be expected to replace the other.
Why reports become rituals
One of the strangest things in business is how quickly a report becomes sacred.
Nobody remembers exactly who first asked for it.
Nobody is completely sure which decision it supports.
But every Friday somebody spends two hours preparing it because every Friday somebody has always spent two hours preparing it.
The file has a name.
Weekly_Operations_Report_FINAL_v7.xlsx
There are colours.
There are formulas nobody wants to touch.
There is one employee who understands why Column Q is important.
Management receives it.
Someone says:
“Thanks.”
And next Friday the whole thing happens again.
Reports become habits.
Once they exist, very few people ask:
“What decision are we making because of this information?”
That should be the first question.
Not:
“How can we automate this report?”
First ask whether the report still deserves to exist in its current form.
Some should absolutely be automated.
Some should be replaced by a live dashboard.
Some should become exception alerts.
Some information may belong in an AI assistant managers can query directly.
And some reports may simply no longer be useful.
The objective is not less technology.
It is better information delivery.
Some reports exist because the business cannot answer questions directly
This is another pattern worth watching.
A manager asks:
“What are our late orders?”
The system cannot answer clearly.
So someone builds a report.
Later:
“Which of those late orders affect priority customers?”
The report cannot answer that.
A second report appears.
Then:
“Which ones have margin risk?”
Another column.
Another export.
Another file.
After a few years, the organisation has built a small reporting industry around questions the operation itself cannot answer directly.
The reporting workload grows because visibility is weak.
Then management concludes it needs better reporting.
Sometimes what it really needs is a better operational view connecting the information already spread across its systems.
That view may absolutely be a dashboard.
But it needs to be built around the decisions the business actually needs to make.
A polished management pack can create false confidence
The report arrives.
Beautiful charts.
Green arrows.
Red arrows.
Variance commentary.
Twenty-five KPIs.
Everything looks controlled.
Except underneath the finished document there may be:
- Manual exports
- Separate spreadsheets
- Different cut-off times
- Someone correcting numbers by hand
- Another person deciding which figure is more reliable
- Three emails asking for missing information
The presentation looks much more controlled than the process producing it.
So I would be careful about equating a sophisticated report with a sophisticated operating model.
A polished report does not automatically mean a controlled business. Sometimes it just means somebody is very good at PowerPoint.
What matters is the reliability and flow of the information underneath.
A dashboard by itself is not operational visibility
Dashboards can be extremely valuable.
We use them because they can turn fragmented information into something management can understand quickly.
But the dashboard only becomes truly useful when the information underneath is reliable and the view is connected to the way the business actually operates.
A dashboard can be live and still be unhelpful.
It can contain 47 KPIs and tell you very little.
It can display information nobody trusts.
It can show what happened but not why.
It can surface a problem without making clear who needs to act.
Or it can sit on top of manually maintained spreadsheets that still require hours of work behind the scenes.
The better goal is:
A dashboard should reduce investigation, not simply display information.
For me:
A dashboard by itself is not operational visibility. Operational visibility is knowing what deserves your attention without having to reconstruct the situation first.
That may be delivered through a live dashboard.
It may also include alerts, an AI assistant, automated workflows or exception notifications.
The right combination depends on the operating problem.
The difference between a dashboard and an operational view
Compare these two examples.
Dashboard:
On-time delivery: 91%.
Useful.
Operational view:
Three high-value customer orders are at risk because Supplier A missed confirmation. Two require action today.
Or:
Dashboard:
Gross margin: 24.8%.
Operational view:
Margin is below expected range on six open orders because freight cost increased and has not yet been reflected in pricing.
The dashboard gives the metric.
The operational layer adds context.
And context is what turns data into something people can act on.
This is where the combination of connected dashboards, assistants and workflows becomes powerful.
The dashboard helps you see.
The assistant can help you understand.
The workflow can help the business act.
That is much closer to genuine operational control.
Management does not need more numbers. It needs better signals.
A common response to poor visibility is adding KPIs.
More metrics.
More charts.
More detail.
This can make the problem worse.
A business owner does not need to know every operational event.
They need to know what is outside expectation, what is changing materially and what requires judgment.
Normal operations should mostly remain normal.
Exceptions deserve attention.
This is one of the biggest differences between traditional reporting and operational visibility.
A traditional report may say:
“Here is everything.”
A better operating view says:
“Here is what changed, why it matters and where you may need to act.”
That is much closer to management by exception.
And it scales much better than management by investigation.
If every number generates another question, you do not have enough visibility yet
Imagine management receives a dashboard.
Revenue is down 8%.
First question:
Why?
Nobody knows.
Margin is down 2 points.
Why?
Need to check.
Stock increased.
Why?
Let's ask operations.
Late orders increased.
Which customers?
Need another report.
At that point, the dashboard is useful as an alarm.
But management still lacks enough context to understand the problem.
This is where stronger operational visibility becomes valuable.
Instead of requiring the manager to investigate every number, the information layer should help answer:
- What changed?
- Where?
- Why?
- Who is affected?
- What requires action?
This does not mean technology makes management decisions.
It means management starts with context rather than starting with a mystery.
The owner should not need to become a data analyst before making a decision
This matters particularly in an SME.
The owner may already be managing customers, employees, suppliers, financing and strategy.
They should understand their numbers.
Absolutely.
But they should not need to become the company's full-time reporting analyst just to know whether something requires attention.
“Self-service data” sounds excellent.
But if self-service means every manager now has to manipulate five datasets before answering a basic operational question, the reporting workload has simply moved.
The goal is not merely to make everyone better at finding answers.
The goal is to make important answers easier to access.
That is where well-designed dashboards and assistants can be extremely useful.
Instead of asking another employee:
“Can you pull this for me?”
a manager may be able to see the relevant exception immediately or ask the operational assistant:
“Which open customer orders are at risk this week, and why?”
That is a very different experience.
Slow decisions are not always caused by slow managers
Management often gets criticised for decision speed.
“Leadership takes too long.”
Maybe.
But sometimes the actual decision takes ten minutes.
Getting enough reliable information to make it takes three days.
That is not the same problem.
Research into organisational decision-making has repeatedly shown that many companies struggle to make decisions both quickly and confidently.
One reason is obvious.
Good decisions need context.
If context is scattered across several systems and people, the delay begins before the decision-maker even starts thinking.
A slow decision may not need a faster leader.
It may need better visibility.
There is also a difference between seeing and understanding
Suppose a dashboard tells you:
Inventory variance: HK$186,000.
That is useful visibility at one level.
But management still wants to know:
- Where?
- Which products?
- Why?
- Physical discrepancy?
- Timing issue?
- Incorrect receipt?
- Reserved stock?
- Supplier-held inventory?
- Data-entry error?
- What needs action?
Numbers without context can still require investigation.
This is why good operational visibility should move through three stages:
See what changed.
Understand why it matters.
Know what happens next.
That is much more valuable than simply making data easier to look at.
From reporting to operational control
This is where connected technology becomes particularly useful.
Imagine a supplier delivery date changes.
Traditional approach:
The information lands in email.
Someone eventually updates Excel.
It appears in Friday's report.
Management sees a late shipment.
Connected operational approach:
The delivery date changes.
The relevant purchase order and customer orders are identified.
The system recognises which customer commitments may be affected.
The dashboard reflects the change.
The appropriate person receives an alert because the situation is outside an agreed threshold.
An assistant can explain which customers, orders and margins are exposed.
A workflow can trigger the appropriate next step.
Management becomes involved only if the commercial impact or exception requires senior judgment.
That is a very different operating model.
The point is not simply having a dashboard.
The value comes from shortening the distance between:
something happening and the right person being able to do something useful about it.
This is where AI can help, but it is not the starting point
AI can make operational visibility dramatically more useful.
It can summarise.
Identify anomalies.
Explain variances.
Answer questions.
Compare periods.
Surface patterns.
All valuable.
But if the underlying information is wrong, late or fragmented, AI simply becomes a faster way to analyse a bad picture.
So the order matters.
First, understand which decisions matter.
Then identify the information those decisions require.
Make sure the underlying information is reliable enough.
Connect it.
Then decide how dashboards, automation and AI can make that information easier to see, understand and act on.
Technology follows the operational problem.
Not the other way around.
What should management actually see?
Not everything.
I would start with five questions.
- What is outside expectation?
- What has materially changed?
- What could affect customers, cash or margin?
- What is likely to become a problem soon?
- What genuinely requires management judgment?
Those questions produce a very different management view from:
“Give me every KPI we have.”
For a trading company, that could mean:
- Supplier commitments that moved
- Orders likely to miss customer dates
- Stock discrepancies affecting open orders
- Margin outside expected range
- Unusual customer credits
- Backorders with commercial impact
- Open transactions requiring senior approval
The point is not fewer dashboards.
The point is better-designed dashboards built around decisions and exceptions rather than data availability alone.
Good visibility should make the business quieter
This is something I strongly believe.
When visibility improves properly, the company should not become noisier.
It should become calmer.
Fewer status questions.
Fewer “Can you check?”
Fewer internal messages.
Fewer emergency meetings.
Fewer reports manually rebuilt.
Fewer escalations caused by missing information.
Managers should spend less time asking:
“What happened?”
and more time deciding:
“What do we do about it?”
That is what good operational technology should achieve.
Not another screen everybody has to monitor all day.
A clearer operating picture that reduces the amount of human chasing required to understand the business.
Two examples of reporting becoming operational capacity
One of the clearest STREVIO examples came from a premium flexible-workspace operation.
The business needed multi-site management visibility, but reporting preparation consumed substantial manual effort.
After redesigning how management information was produced and accessed, reporting became approximately 90% faster, manual report preparation fell by around 95%, and management gained live visibility across the sites.
The interesting result was not simply faster reporting.
The same management team was able to perform roughly twice as many operational reviews.
That is the relationship between reporting and capacity.
The information did not merely become cheaper to produce.
Management became capable of using it more often.
In a manufacturing operation, reporting became approximately 80% faster while manual coordination fell around 70%. Throughput increased roughly 35% without additional administrative headcount.
Again, the value was not:
“The report is faster.”
The value was that faster, clearer information changed how effectively the operation could be managed.
Those are individual client results, not universal benchmarks.
Different businesses will naturally achieve different outcomes.
But they illustrate what matters.
Reporting has value when it changes the business's ability to act.
Before automating a report, ask why it exists
Take each recurring report and ask:
What decision does this report support?
Then:
- Who makes that decision?
- What information do they actually use?
- How often does that decision need to be made?
- How quickly after the event does the information remain useful?
- What happens when something falls outside expectation?
Suddenly the reporting requirement becomes clearer.
Maybe the monthly report is perfect.
Keep it.
Maybe a weekly report contains one piece of information that actually needs daily attention.
Move that information into a live operational dashboard.
Maybe management needs to interrogate the information regularly.
Add an assistant.
Maybe an exception should automatically create a follow-up.
Add a workflow.
Maybe half the existing report is historical information nobody uses.
Remove it.
This is how reporting gets redesigned around management instead of management being redesigned around reports.
Start with the decision, then design the dashboard around it
I would make this the principle.
Do not begin:
“Which KPIs can we put on a dashboard?”
Begin:
“Which decisions do we repeatedly struggle to make?”
Then work backwards.
For example:
Decision:
Should we contact the customer because their order is at risk?
What information is required?
Customer commitment.
Current order status.
Supplier confirmation.
Expected shipment date.
Available inventory.
How quickly do we need it?
Before the delay becomes unavoidable.
Who should act?
Customer service or operations first.
When should management get involved?
Only if the customer, value or risk exceeds an agreed threshold.
Now the dashboard has a clear purpose.
So does the alert.
So does the assistant.
So does the workflow.
Technology becomes much more useful when the decision defines the design.
More reports are not necessarily better reporting
Some businesses reach a point where managers receive so much information that visibility actually gets worse.
Daily email.
Weekly Excel.
Monthly dashboard.
Quarterly pack.
Department report.
Exception report.
ERP export.
Power BI.
Someone eventually asks:
“Which one should I actually look at?”
That is not operational visibility.
It is data tourism.
The answer is not to reject dashboards or reporting.
It is to remove duplication and create a clearer hierarchy.
- Which information belongs in a live operational view?
- Which belongs in an exception alert?
- Which requires periodic financial reporting?
- Which questions should be answered by an assistant?
- Which recurring action should become part of a workflow?
A number does not become more valuable because management receives it in four formats.
The best reporting process may be one nobody has to prepare manually
Imagine management opens the operational dashboard Monday morning.
No employee spent Friday afternoon assembling it.
The information is current.
The key metrics are already there.
Important changes have context.
Exceptions are visible.
Management can ask a question through the assistant without first requesting another spreadsheet.
When something needs action, the workflow can help move it to the right person.
People still analyse.
People still think.
People still challenge the numbers.
But their time starts at:
“What does this mean?”
instead of:
“Where is the data?”
That is the difference.
It moves human effort away from reconstruction and toward judgment.
And judgment is what you are actually paying experienced managers for.
The faster you see reality, the longer you have to change it
That is ultimately why reporting speed matters.
Not because producing a report in ten minutes instead of four hours is technologically impressive.
The business benefit comes from what the extra time allows you to do.
Call the supplier earlier.
Adjust the customer promise.
Change the price.
Stop an order.
Move stock.
Challenge a cost.
Resolve a discrepancy.
Protect margin.
Escalate an exception.
Or decide that nothing needs doing and move on.
Better visibility creates options.
And options disappear with time.
Stop reconstructing the business after it happens
Management should absolutely review the past.
Financial reporting matters.
Historical trends matter.
Weekly and monthly reviews matter.
But the operation should not be controlled entirely through retrospective reconstruction.
If every important question requires:
- An export
- A spreadsheet
- Three colleagues
- Half a day
the business has an operational visibility problem.
The answer is not simply producing more reports.
It is building a better way to see, understand and act on the information already moving through the business.
That may include:
- Connected live dashboards
- An operational assistant
- Automated alerts
- Workflow automation
- Exception management
- Integration with the ERP, CRM, accounting and other systems the company already uses
Start with the decision.
Understand its window.
Identify the information required.
Connect and trust that information.
Then design the technology around how management actually needs to operate.
Because:
The report is not the business. It is a delayed explanation of the business.
The goal is not to explain yesterday beautifully.
It is to understand today while you can still do something about tomorrow.
Not Sure Where Your Business Is Losing Capacity?
That's Exactly What This Is For
When you work inside a business every day, inefficient workarounds stop looking like workarounds — they simply become “the way we do things.” That's exactly why we built the STREVIO Free Operational Capacity Assessment: a self-service, 3-minute check with no consultation and no technical knowledge required, giving you a first view of where your business may be losing time, profitability and visibility, and where to look first.
Take the Free Operational Capacity AssessmentFrequently Asked Questions
Why does business reporting take so long?
Reporting often takes time because data sits across different systems, spreadsheets and departments. Employees may need to export information, reconcile different versions, correct missing data, obtain updates from colleagues, calculate KPIs manually and add management commentary before the report is usable. The time spent creating the final report is often only the visible part of a wider information-flow problem.
What is reporting latency?
Reporting latency is the delay between something happening in the business and the relevant decision-maker receiving useful information about it. For example, if a supplier misses a commitment Monday but management only sees the issue Friday, the information may still be correct while the value of acting on it has already fallen.
What is the difference between reporting and operational visibility?
Reporting organises business information into a useful format. Operational visibility focuses on making important information available while there is still time to act. A strong operational-visibility solution may include live dashboards, alerts, AI-assisted understanding and automated workflows around the underlying business systems.
Does every business need real-time reporting?
No. Different information has different decision windows. Some exceptions may require immediate attention. Other information is perfectly adequate weekly, monthly or quarterly. The goal is not real-time everything. It is getting the right information to the right person at the point where action still creates value.
Can dashboards improve operational visibility?
Absolutely. Dashboards can be extremely effective when they are built on reliable, connected information and designed around real management decisions. The problem is not dashboards themselves. The problem is expecting a dashboard alone to solve fragmented data, unclear ownership or disconnected workflows. The strongest dashboards reduce investigation and make important exceptions easier to understand.
What should a management dashboard show?
There is no universal list. A useful management dashboard should focus on information connected to actual decisions. This often includes significant changes, exceptions, risks, trends and activities outside agreed thresholds. The objective is not to display every KPI available. It is to help management see what deserves attention.
How can an SME reduce manual reporting?
Start by identifying which recurring reports support real decisions. Then determine where the information comes from, how much manual reconciliation is involved and which steps are repeated. The business can then connect systems, automate calculations and reporting, create live dashboards, introduce alerts or use an assistant to make information easier to access.
Can AI improve management reporting?
Yes. AI can help summarise information, explain variances, identify anomalies and let managers ask questions about operational data. Its value increases when the underlying information is reliable and connected. AI should complement good operational data and reporting design, not compensate for poor information quality.
How do I know which reporting process to improve first?
Look for reporting processes that combine high manual effort with high business importance. A report that requires several hours every week and directly affects customer, inventory, cash, margin or operational decisions is usually a stronger candidate than a low-frequency report nobody actively uses. Before redesigning it, identify the decision it supports and how quickly that decision needs the information.
About The Author
Alexandre Besson
Co-Founder & Chief Business Strategist, STREVIO
After more than 20 years running operations across Europe and Asia, Alexandre focuses on helping SMEs remove the manual coordination, information gaps and repetitive work that make businesses harder to run as they grow. STREVIO helps businesses recover Operational Capacity by connecting the systems and information they already use, improving operational visibility and orchestrating workflows so existing teams can handle more business without adding people, cost and complexity at the same rate.